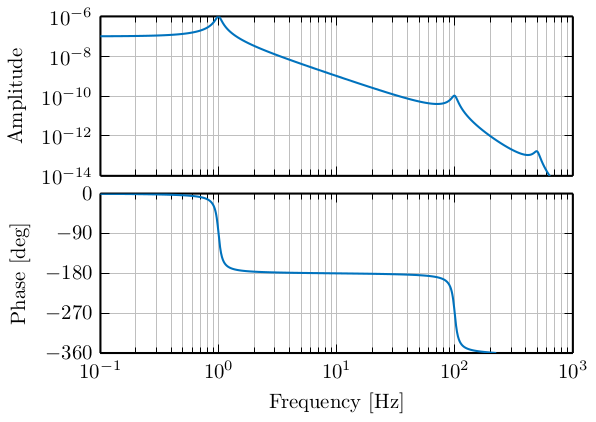
Tikz - Matlab figs
Table of Contents
1 Bode Plot
1.1 Size
1.2 Colors
1.3 Data - Magnitude
1.4 Data - Phase
1.5 Plot
<<tikz_bode_size>>
<<tikz_bode_colors>>
\begin{tikzpicture}
\begin{axis}[%
  width=\fwidth,
  height=0.45\fheight,
  at={(0\fwidth,0.5\fheight)},
  scale only axis,
  separate axis lines,
  every outer x axis line/.append style={black},
  every x tick label/.append style={font=\color{black}},
  every x tick/.append style={black},
  xmode=log,
  xmin=0.1,
  xmax=1000,
  xticklabels={{}},
  xminorticks=true,
  every outer y axis line/.append style={black},
  every y tick label/.append style={font=\color{black}},
  every y tick/.append style={black},
  ymode=log,
  ymin=1e-14,
  ymax=1e-06,
  ytick={1e-14, 1e-12, 1e-10, 1e-8, 1e-6},
  % yticklabels={{1e-14}, {}, {1e-10}, {}, {1e-6}},
  yminorticks=true,
  ylabel={Amplitude},
  axis background/.style={fill=white},
  xmajorgrids,
  xminorgrids,
  ymajorgrids,
  yminorgrids
]
<<tikz_bode_magnitude>>
\end{axis}

\begin{axis}[%
  width=\fwidth,
  height=0.45\fheight,
  at={(0\fwidth,0\fheight)},
  scale only axis,
  separate axis lines,
  every outer x axis line/.append style={black},
  every x tick label/.append style={font=\color{black}},
  every x tick/.append style={black},
  xmode=log,
  xmin=0.1,
  xmax=1000,
  xminorticks=true,
  xlabel={Frequency [Hz]},
  every outer y axis line/.append style={black},
  every y tick label/.append style={font=\color{black}},
  every y tick/.append style={black},
  ymin=-360,
  ymax=0,
  ytick={-360, -270, -180, -90, 0, 90},
  ylabel={Phase [deg]},
  axis background/.style={fill=white},
  xmajorgrids,
  xminorgrids,
  ymajorgrids,
  legend style={at={(0.01,0.02)}, anchor=south west, legend cell align=left, align=left, draw=black}
]
<<tikz_bode_phase>>
\end{axis}
\end{tikzpicture}
